Note
Beanviser can also be used to monitor apps running on an emulator.
Beanviser can also be used to monitor apps running on an emulator.
Beanviser is a performance monitoring and diagnostics tool that remotely communicates with a webOS device and evaluates apps running on the device. It provides the following benefits:
Beanviser is a simple and easy-to-use tool; in just few clicks you can connect to a device and start monitoring and debugging apps. Check the video below for a basic walkthrough.
Beanviser provides a comprehensive set of features:
With Beanviser you can evaluate how your app performs in a live environment and check for issues before the app is deployed for commercial purposes. Therefore, we recommend that you let Beanviser evaluate the app for a few days, to give you a real-life view into the operation of the app.
Check out the software and hardware requirements to use Beanviser.
| OS | Requirement |
|---|---|
| Linux | Ubuntu 14.04, 16.04, 18.04 or Ubuntu Mint (Maya) |
| macOS | 10.12 (Sierra) and 10.13 (High Sierra) (64-bit) |
| Windows | Windows 7 or higher |
| HW Component | Requirement |
|---|---|
| CPU | Intel® Pentium® 4 2.0 GHz or faster |
| Memory | Minimum 3 GB |
| VGA | 1280 x 1024 or greater |
| Graphic Card | 256 MB or more of video memory |
Perform the following steps to get started with Beanviser.
No installation is required; simply download the package from the SDK download page based on your operating system and unpack the archive to a desired location.
The following table details the steps to launch Beanviser on different operating systems:
| Operating System | To Launch... |
|---|---|
Linux |
|
macOS |
|
Windows | On windows, you can use file explorer or command prompt. Using file explorer:
Using command prompt:
|
You must first add the target device on Beanviser and then connect to that device as follows:
Click the Configuration button (…) to get a list of available devices.
To add a new device, click the + button and provide the details of the target device:
| Item | webOS Device | Emulator |
|---|---|---|
| Name | Any name | Any name |
| Host | <IP address of the device> | 127.0.0.1 (local emulator) or remote IP address |
| Port | 22 | 6622 |
| Username | root | root |
To connect to a target device, select it from the device list and click the Connect button.

This section shows the typical layout of the Beanviser user interface and then explains the key Beanviser features and how to use them.
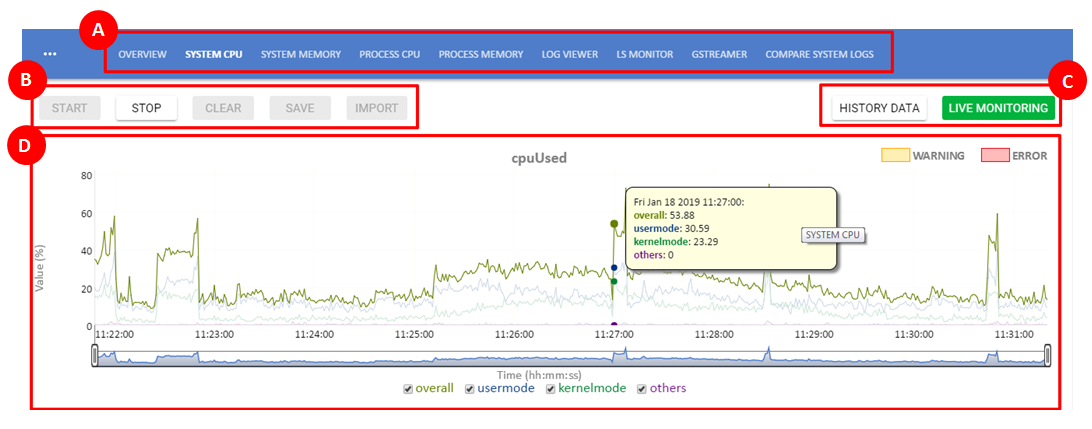
A brief overview of the different elements of the Beanviser user interface.
| Part | Description |
|---|---|
A (Function tabs) | Each tab corresponds to a key Beanviser function. For details on each function, see Beanviser Functions. |
B (Operation tabs) | The operations that you can perform for a Beanviser function.
|
C (Data modes) | The type of data to be displayed.
|
D (Data view) | The data (graph or table) is displayed here. |
A detailed description and usage of each Beanviser function.
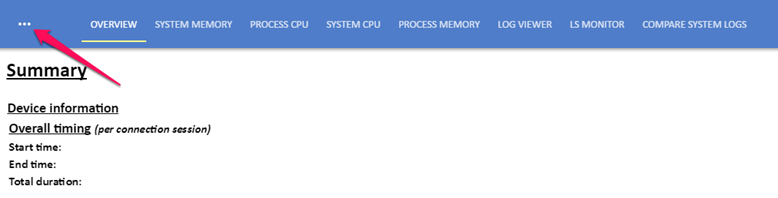
This tab provides a summarized view of all the information collected by Beanviser. This information is updated in real-time, while measuring is active.
You can export this information as a PDF file onto the local system.
Provides CPU utilized by the system, which is categorized based on:
The above information is displayed in the following graphical views:
How to…
Provides memory consumed by the system. It is categorized based on how much memory is:
The above information is displayed in the following graphical views:
How to…
Provides CPU utilized by different processes, which includes:
How to…
General Usage: Start the operation > View the data > Stop the operation
Plot data for specific processes: By default, the graph shows only system-level CPU utilization. To plot for a specific process, select it from the list displayed in the top-right corner.
Provides memory consumed by different processes, which includes:
The above information is displayed using the following metrics:
How to…
General Usage: Start the operation > View the data > Stop the operation
Plot data for specific processes: By default, the graph shows only system-level CPU utilization. To plot for a specific process, select it from the list displayed in the top-right corner.
Use this view to see the platform logs that are available on the webOS device. You can filter the logs based on:
How to…
Provides details of traffic going over the webOS service bus (Luna Bus); similar to a network sniffer that lets you observe HTTP traffic.
How to…
General Usage: Start the operation > View the data > Stop the operation
Generate the sequence diagram (Available from Beanviser v2.0.0): Once the list is generated, use the Draw Flow option to create a diagram that shows sequence in which service calls are executed.
(Available from Beanviser v2.0.0)
Provides the following information:
How to…
Allows you to compare log files taken at different times.
[Beanviser-installation-path]/logs directory. The log file name specifies the timestamp and the log type.How to…
In addition to its key features, Beanviser allows you to enhance the usability and also perform some other miscellaneous operations.
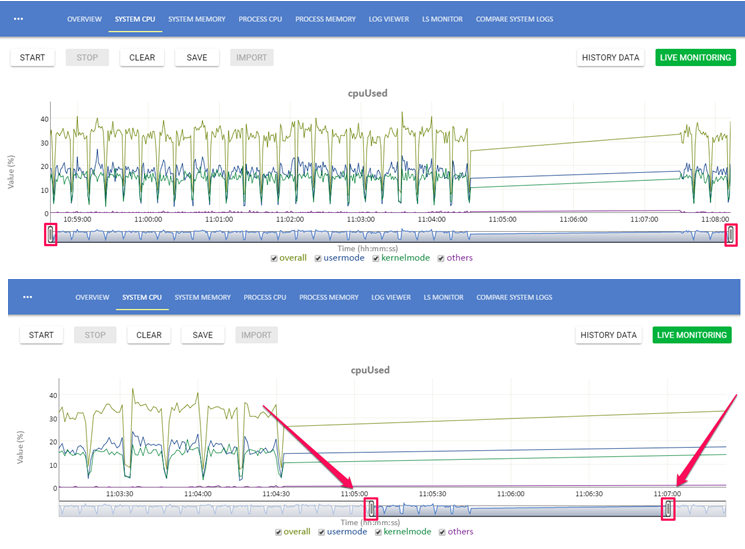
Use the navigation bar to zoom-in or zoom-out on a certain area of the chart. This is explained with the help of the following example:
Navigation bar handles moved from the default position to a certain time frame.
Before moving the navigation bar, the graph shows data from 10:59:00 to 11:08:00.
After moving the navigation bar, the graph shows data from 11:05:00 to 11:07:00.
In other words, the graph from 11:05:00 to 11:07:00 has been zoomed in.
When you do not need to visualize the performance, you can choose to start background logging. In this feature, Beanviser collects logs for the specified duration and stores it on the target device. You can later retrieve these to your local system.
To start background logging:
After connecting to the device, click the Configuration button  on the top-left corner.
From the Main Menu  , click Start Logging.
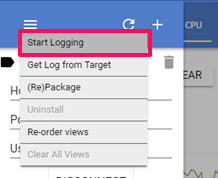
Enter the duration (in Seconds) for logging and click START.
To retrieve the log file from the target device and store on your local system ([Beanviser installation path]/logs):
Click the Configuration button on the top-left corner.
From the Main Menu , click Get Log from Target.
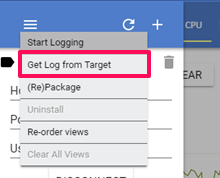
The info dialog will appear and show you where the log file is.
When you connect to a device, a Beanviser service, which is packaged in a dummy app, gets installed on the webOS device. The Beanviser tool requires this Beanviser service, so that it can communicate with the device.
If the Beanviser service is updated, the updated IPK file must be re-installed on the webOS device (as described below). Therefore:
If connecting to a new device, the service is automatically copied to device.
If connecting to a previously connected device (which already has the Beanviser service), you are prompted to re-install the Beanviser service.
To update the service on the Beanviser installation:
Update the source code of the Beanviser service that is provided in the [Beanviser_installation_path]/service directory.
Use the Beanviser tool to repackage the service.
Click the Configuration button on the top-left corner.
From the Main Menu , click (Re)Package.
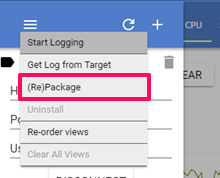
If successful, Beanviser displays a success message and updates the Beanviser service IPK file.
To remove the Beanviser service from a target device:
Click the Configuration button on the top-left corner.
Select the device from the device list.
Disconnect the target device.
From the Main Menu , click Uninstall.
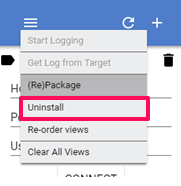
If successful, Beanviser will display a success message.
You can customize the tab order within the Beanviser UI. You can also control if a tab is to be hidden or shown in the UI.
To customize the tabs:
Click the Configuration button on the top-left corner.
From the Main Menu , click Re-order Views.
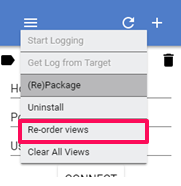
The customization table will be displayed as shown below.
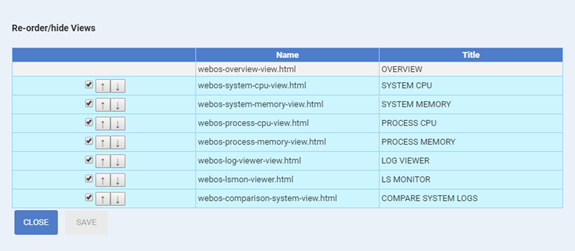
To hide or show tabs on the screen, use the check boxes.
To change the order of the tabs, use the arrow buttons.
You can clear the charts in all tabs regardless of whether Beanviser is connected to a device or not.
To clear the charts:
Click the Configuration button on the top-left corner.
From the Main Menu , click Clear All Views.
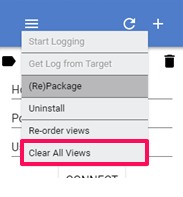
If successful, the charts on each tab will be cleared.
► How to resolve the following error:
Error Installing the perf service ...
luna-send command failed (Unknown method "install" for category "/dev/")
Diagnosis: This error occurs when connecting to a device, if the “dev mode” feature is not enabled on the device.
Resolution: Enable the “dev mode” feature as follows:
Connect to device using an SSH client (like Putty).
Enable the “dev mode” feature by calling the setDevMode method using the luna-send command.
Restart the device.
► When are warnings/errors displayed in System CPU view?
Warning and error indicators are shown on the graph when CPU utilization exceeds the following threshold values:
► When are warnings/errors displayed in System Memory view?
Warning and error indicators are shown on the graph when memory consumption exceeds the following threshold values:
► When are warnings/errors displayed in Process CPU view?
Warning and error indicators are shown on the graph when CPU utilization exceeds the following threshold values:
► When are warnings/errors displayed in Process Memory view?
Warning and error indicators are shown on the graph when memory consumption exceeds the following threshold values:
Contents