Note
See also the Change Log | VS Code marketplace.
See also the Change Log | VS Code marketplace.
webOS Studio is an Microsoft Visual Studio Code (VS Code) extension for webOS. Using this extension, developers easily start to make webOS apps/services (web app, Enact app, JS service).
Key features are as follows:
To install the extension, launch VS Code and do the following steps:
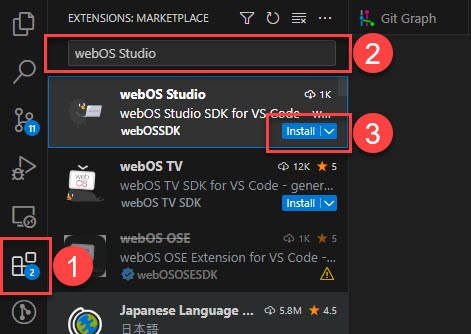
Then you will see the ![]() icon in Activity Bar.
icon in Activity Bar.
Click the ![]() icon to see the user interface of the extension:
icon to see the user interface of the extension:
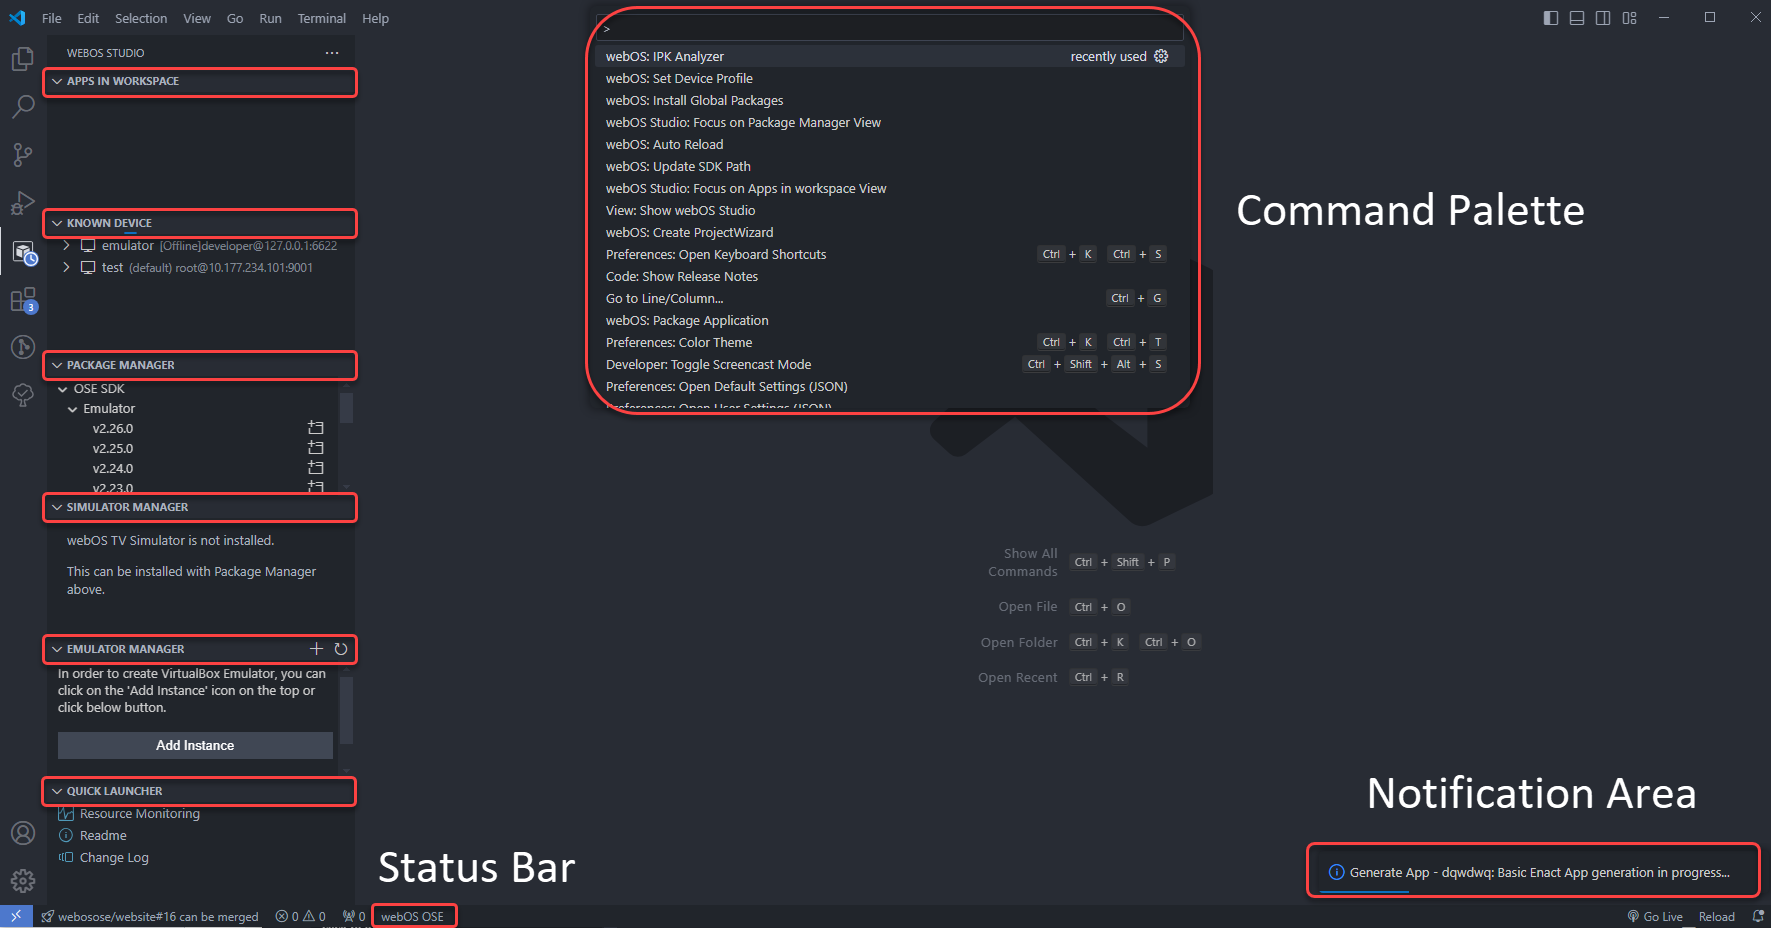
User Interface of the webOS Studio
| Component | Description |
|---|---|
| APPS IN WORKSPACE | Lists apps in the workspace. The workspace of webOS Studio is different from that of VS Code. For more details, refer to webOS Studio | VS Code marketplace. |
| KNOWN DEVICE | Lists the known devices registered by webOS Studio or CLI. By default, a dummy emulator image is listed in the view. To use it, you have to install VirtualBox Emulator. See the Emulator Manager section. |
| PACKAGE MANAGER | Lists available webOS SDKs for the current profile. |
| SIMULATOR MANAGER | This is only for webOS TV. |
| EMULATOR MANAGER | Lists installed VirtualBox Emulator images. |
| QUICK LAUNCHER | Provides links to webOS Studio documents and tools. |
| Command Palette | Executes various commands. (Shortcut for Windows/Linux: Ctrl + Shift + P, for macOS: Command + Shift + P) For a full list of supported commands, see Command Palette. |
| Notification Area | Shows notification messages for completion, errors, and more about the extension. |
| Status Bar | Changes webOS Studio’s profile. |
This section explains a typical development flow of webOS apps and services using this extension.
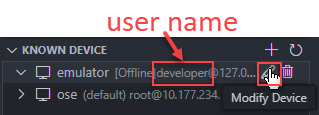
Click the + button in the KNOWN DEVICE view.
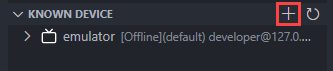
Enter the name, IP, port, and username of your webOS device.
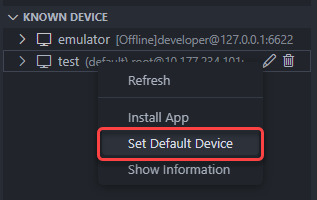
(Optional) Set the device as the default device. Actions that don’t specify the webOS device will be performed on the default device.
First, let’s create an app for webOS device. Do one of the following:
webOS: Create ProjectWizard in the Command Palette.Then the Project Wizard window will be displayed.
| Item | Description |
|---|---|
| webOS Product | A target platform which this app/service will be installed on. This option also changes the webOS Studio’s profile. |
| API Version | An API level of webOS. Different versions of the webOS platform support different levels of APIs. See API Levels. |
| Item | Description |
|---|---|
| Template | webOS Studio provides multiple template for webOS apps/services. Supported templates are as follows:
|
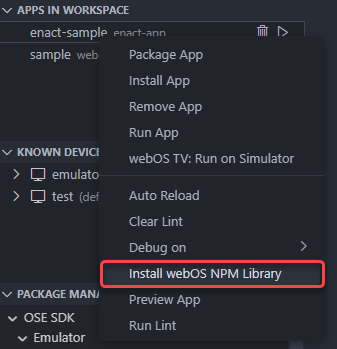
webos-service library is a library for using webOS components on JS services or Enact apps. This library is for legacy webOS OSE devices (for version 1.x.x).
To use the library, do one of the following:
Check the Yes button for Add webOS library.
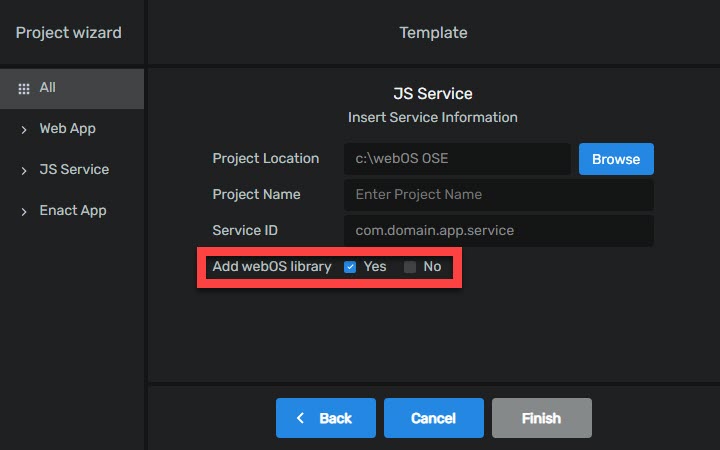
Install it in the APP IN WORKSPACE view.
Now it’s time to implement your own features on the created apps or services.
webOS Studio supports a powerful content-assist feature called Auto-Completion. Auto-completion includes API suggestions and automatically completes method names, helping users implement webOS features more easily.
For more details about the auto-completion feature, see Auto-Completion.
While you editing an app, You can preview the app UI before installing it.
In the APPS IN WORKSPACE view,
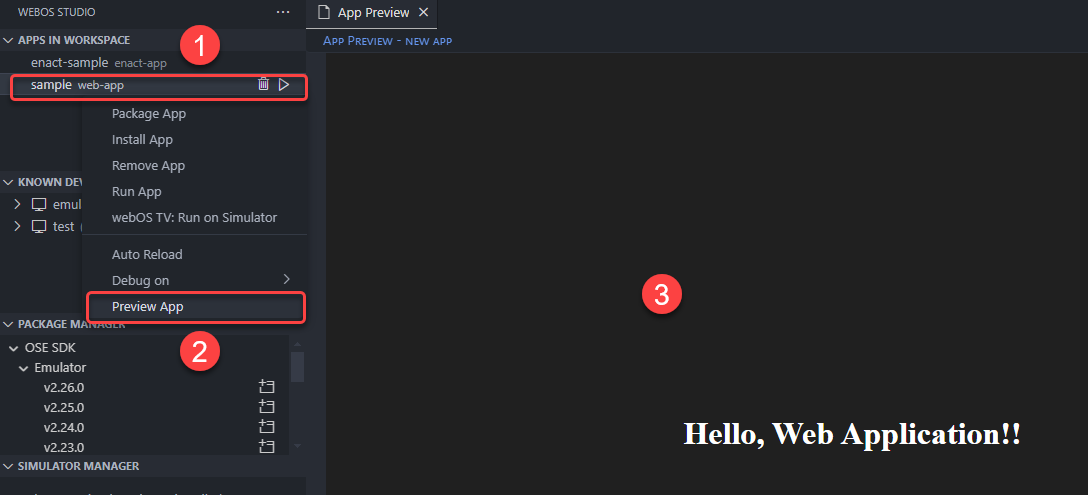
In the preview, you can modify the source codes and check the results instantly.
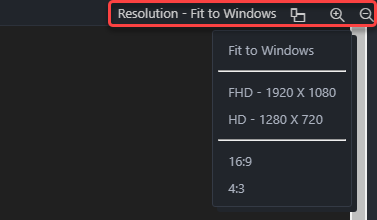
You can also change the resolution of the preview.
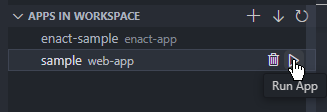
Typical steps to install webOS apps are as follows:
.ipk file.The above three steps are triggered sequentially by clicking the Run App button in the APPS IN WORKSPACE view.
Then, enter the information about the app. If you use the default information, just press the Enter key.
You can uninstall the apps in the KNOWN DEVICE view.
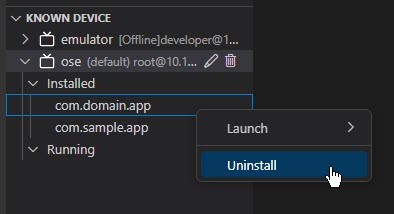
Or You can uninstall the app manually using the appInstallService API or webOS CLI.
You can debug apps or services that are installed on the known devices. Supported types are as follows:
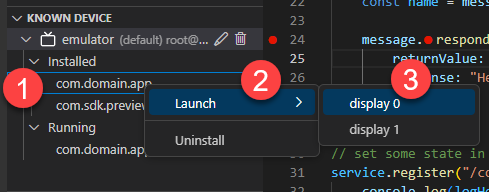
Right-click an installed app.
Click Debug on.
Click inspector or VS Code.
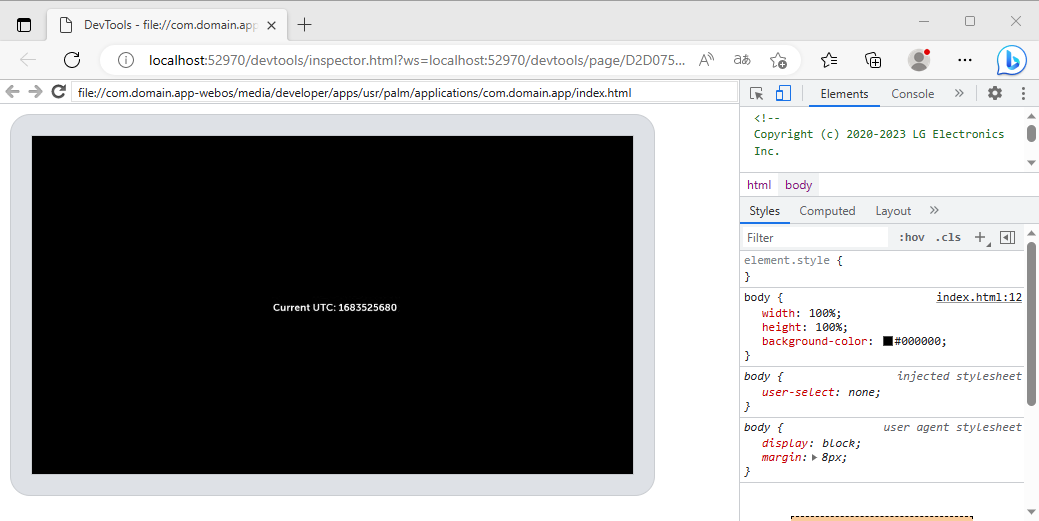
[inspector]
Enter a path for the browser executable.
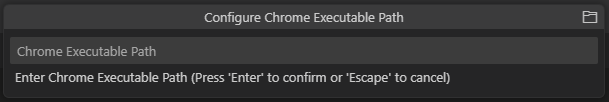
Then the debugging session will be activated in the browser.
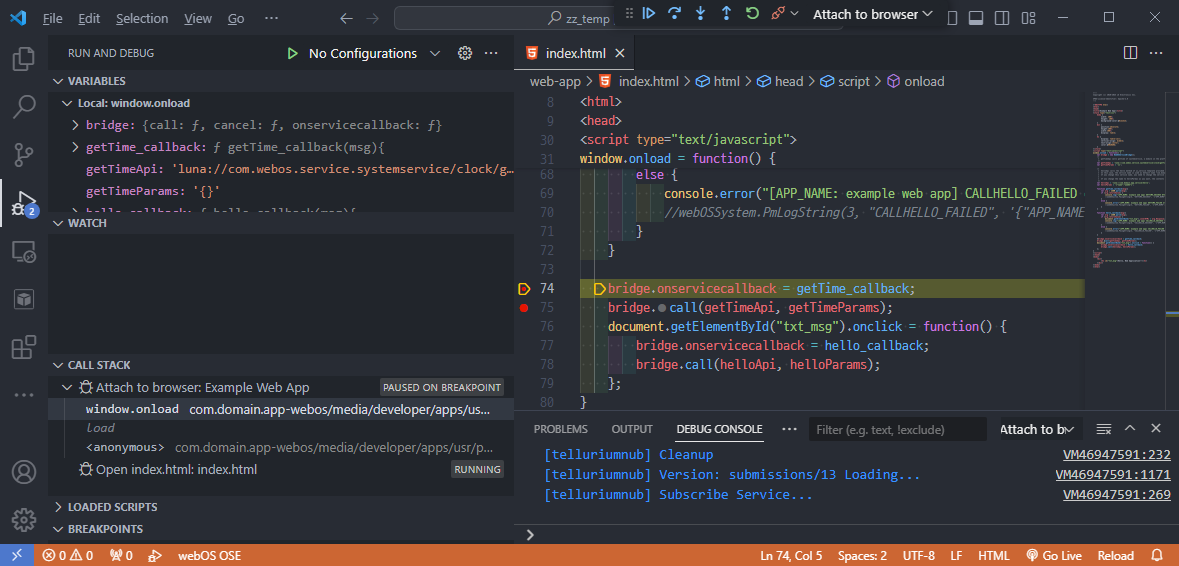
[VS Code]
The DEBUG CONSOLE panel will be activated automatically. In the panel, you can check the console messages from the app or service.
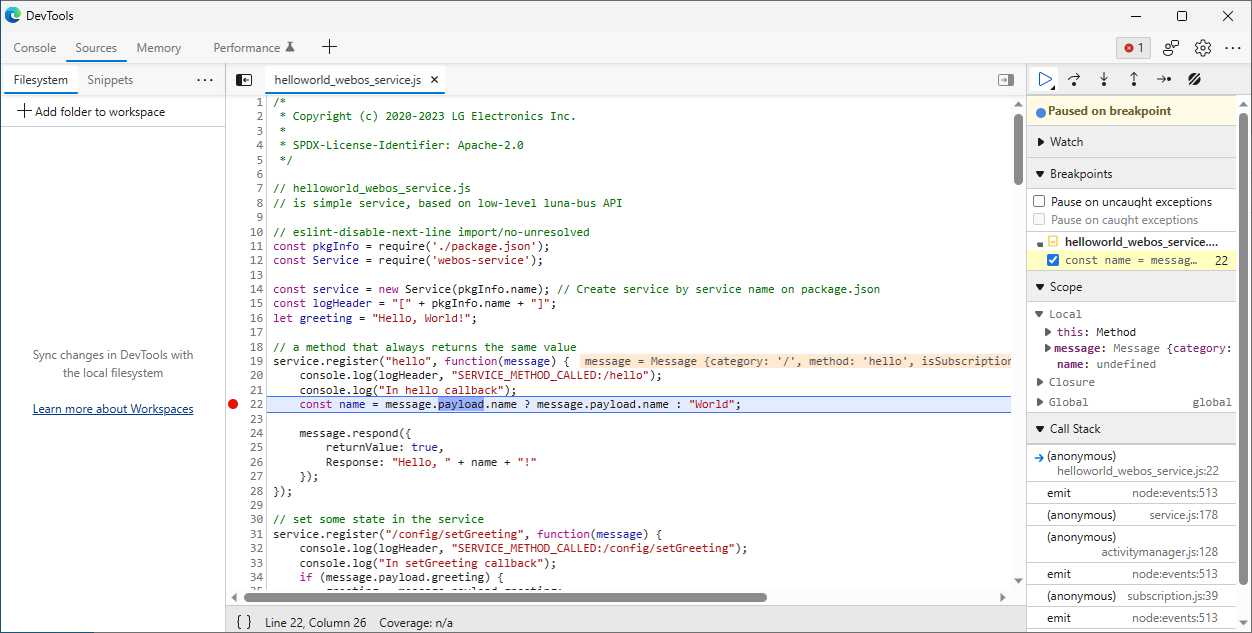
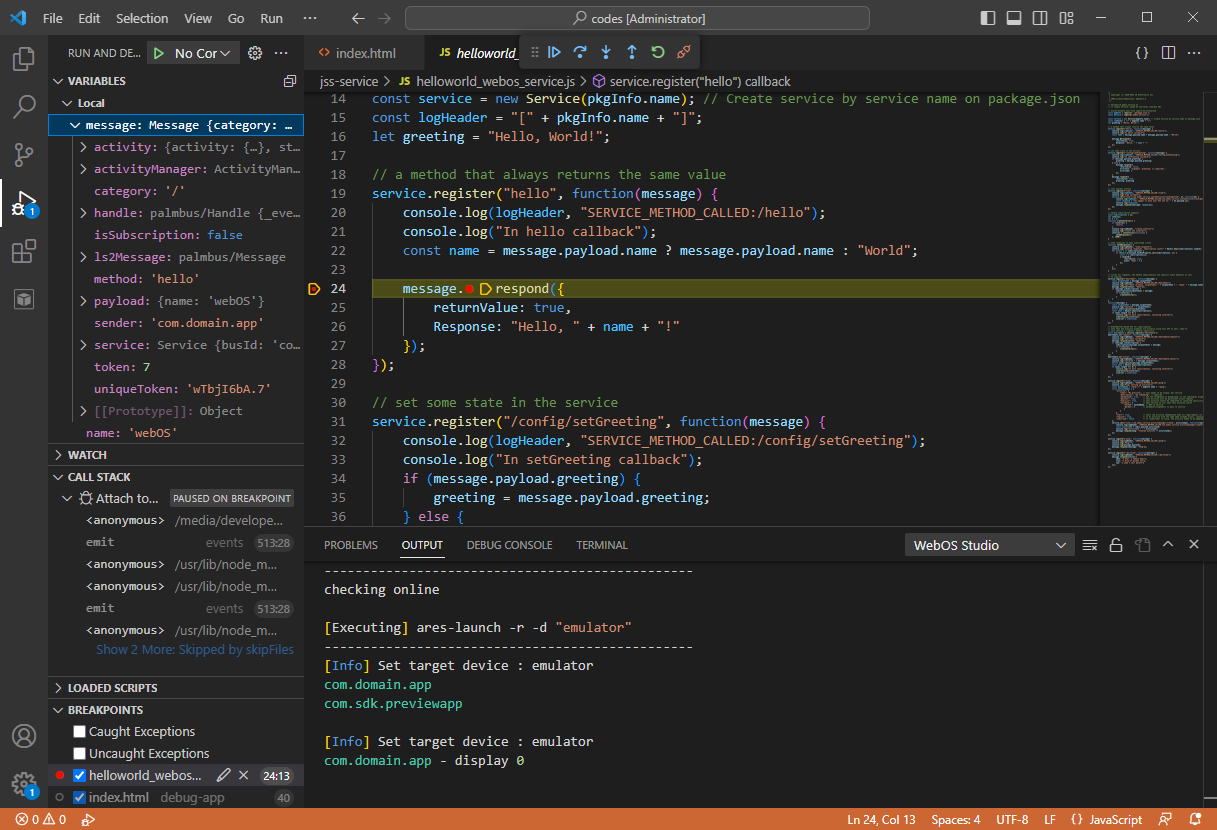
In the debugging session, you can set breakpoints, check variables, callstack, etc.
Right-click an installed service.
Click Debug on.
Click inspector or VS Code.
[inspector]
After clicking the inspector button, a URL for the debugging session will be displayed in the OUTPUT panel. Copy the URL.
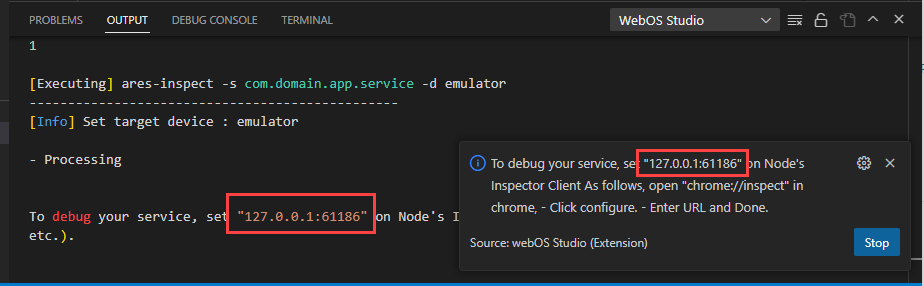
Open your browser and go to chrome://inspect. Configure the URL as follows:
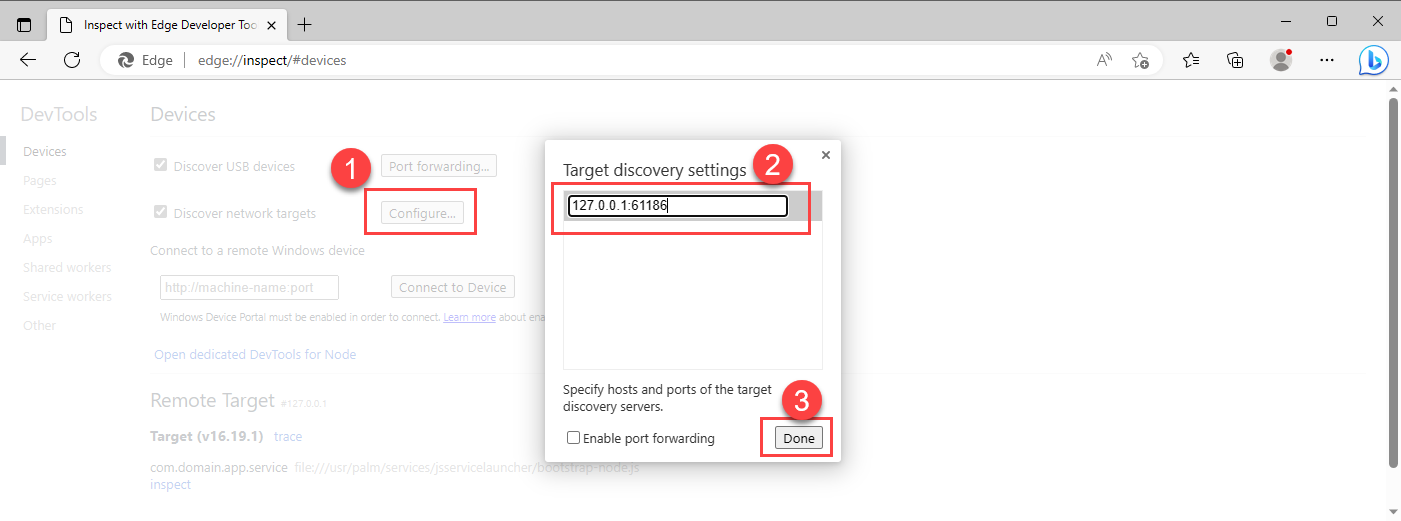
Click inspect.
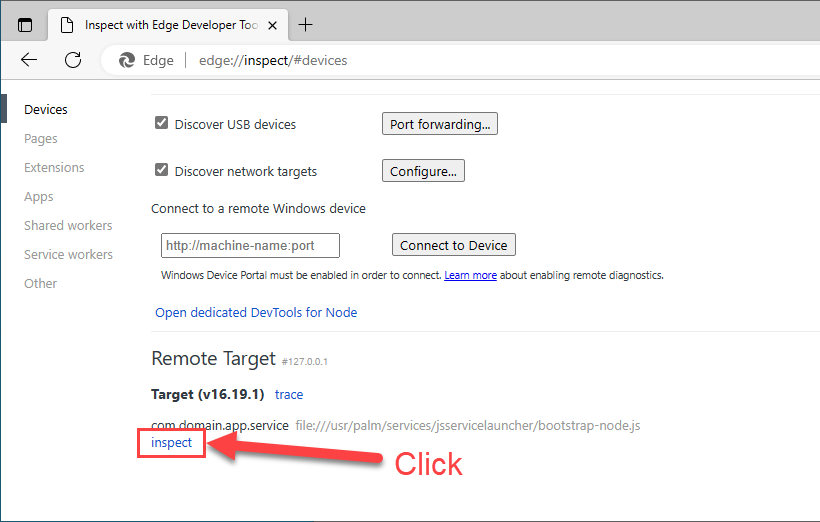
This opens a new window for the debugging session.
[VS Code]
The DEBUG CONSOLE panel will be activated automatically.
Click View > Open View... > Run and Debug.
Close all running apps on the webOS device and re-try to click Debug on.
If you get this notification, even when all debug sessions are closed, restart the VS Code and try to start a debugging session again.
ESLint statically analyzes files for potential errors (or warnings) and helps enforce a common coding style. For more information, check ESLint Configurations.
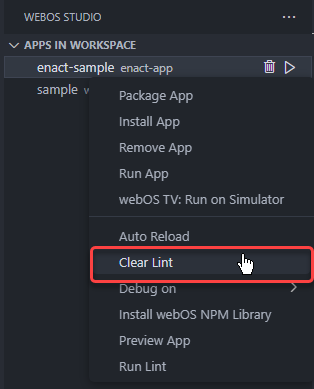
In the APPS IN WORKSPACE view,
The PROBLEMS panel shows the result messages.
To clean the Lint messages from the panel, click Clear Lint.
Auto-completion suggests a list of available LS2 APIs based on the project’s API level.
Key features are as follows:
Tab keyTo use auto-completion, type one of the following trigger strings:
luna://new LS2Requestluna://
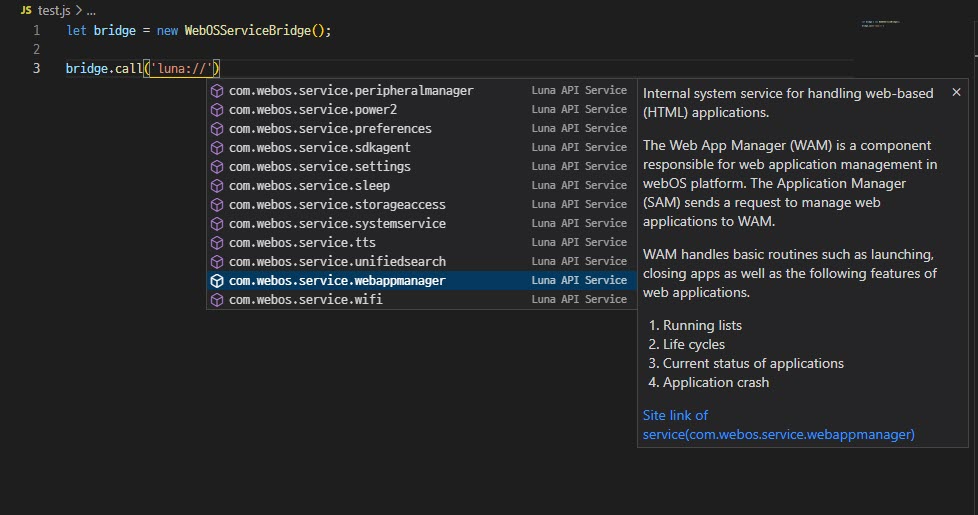
To start the auto-completion feature, enter one of the following strings:
luna://'luna://'"luna://"
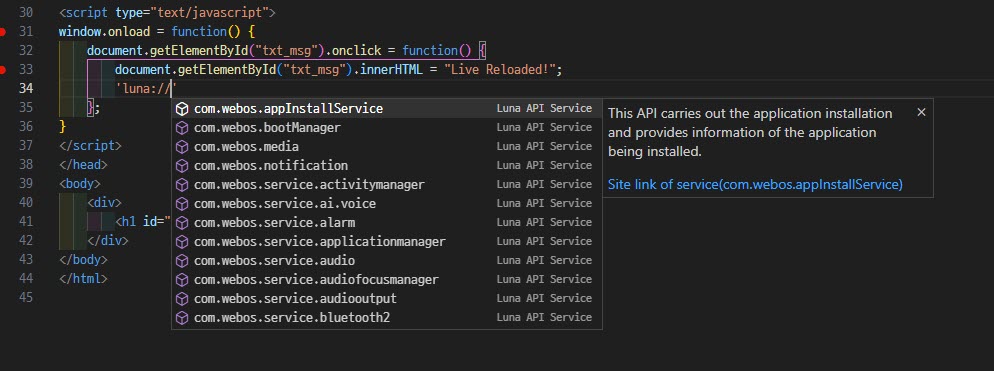
You can print the list of available services, methods, and parameters using the following trigger strings:
| Item | Trigger String |
|---|---|
| Service | luna:// |
| Method | Enter the / right after luna://<service name> |
| Parameter | Ctrl + Space after luna://<service>/<method> |
new LS2Request
Type new LS2Request to use Enact webos Library. Using Ctrl + Space, you can use the auto-completion.
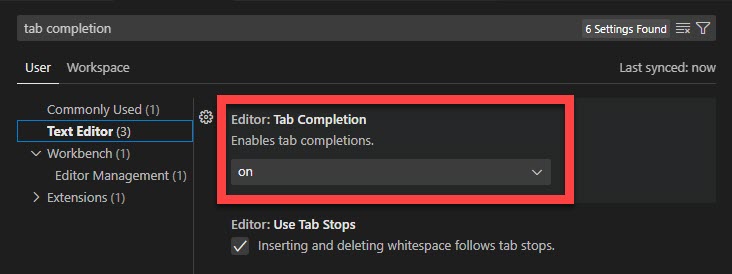
Check the Tab Completion setting is on.
To use auto-completion, .webosstudio.config file should be in the project root folder. This file contains information about the API level.
This file will be automatically generated if you generate a project using the Project Wizard. In case you don't have this file, generate the file as follows:
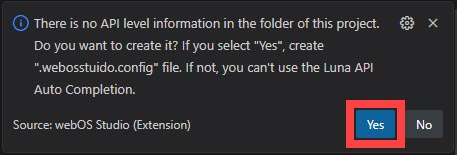
Type luna://.
This invokes a notification to generate the config file. Click Yes.
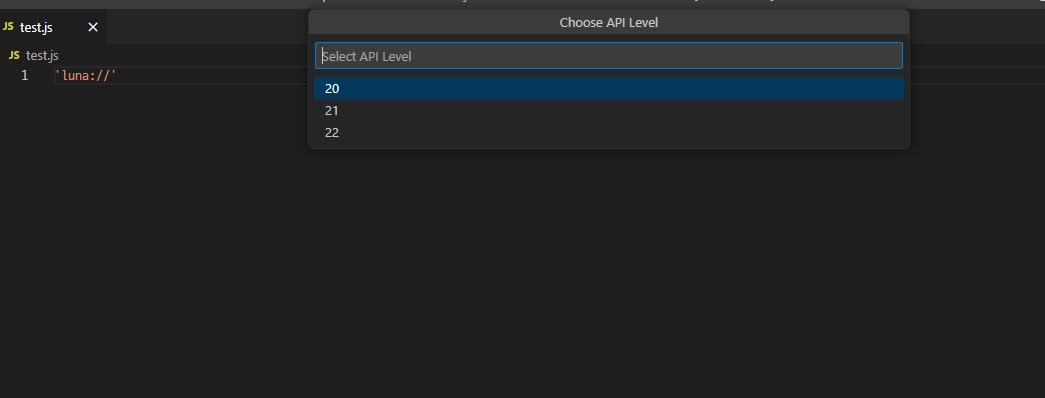
Then a Quick Pick pop-up appears at the top of VS Code.
Enter the API level you want.
The config file is generated in your project folder. You can check the API level in the config file.
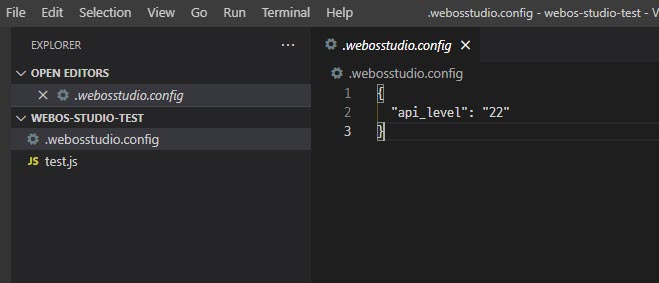
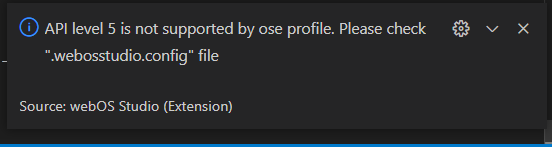
If the API level in the config file is not supported by the current profile, an error notification will be displayed. Currently supported API levels in the OSE profile are 20-25, 27-29, and 31. See also, API Levels
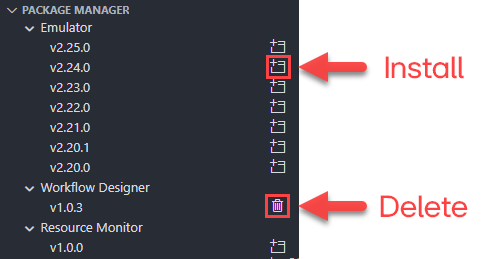
Package Manager manages SDKs for webOS app development. Users can install and uninstall SDKs with a simple click.
To use the Package Manager, you have to prepare the followings:
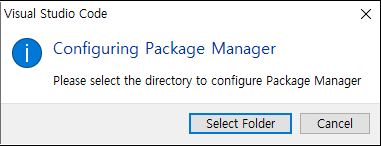
When the user runs webOS Studio for the first time, a pop-up for selecting a directory will show up. This directory stores configurations and downloaded files for the Package Manager.
To change the set directory, follow the below steps:
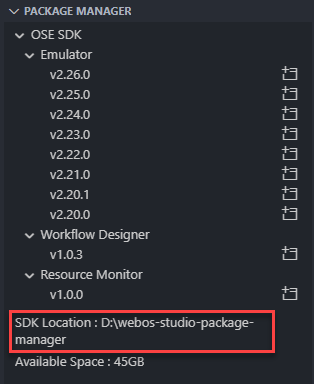
You can check the current set directory at the bottom of the Package Manager view.
webOS OSE Emulator requires Emulator Launcher. Install it before use the emualtor feature.
From webOS Studio v2.1.0, the Package Manager automatically updates the package list.
Every time the VS Code launches (the webOS Studio extension launches), the extension checks if the newer version of SDKs exist. If the newer version exists, the list will be updated automatically.
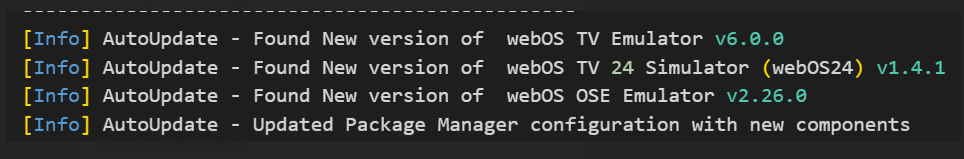
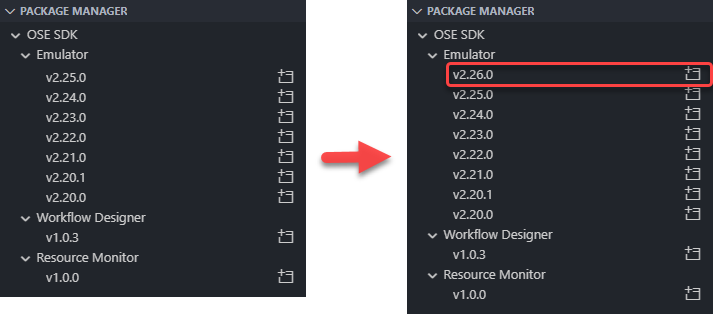
This update is also reflected in the Package Manager component.
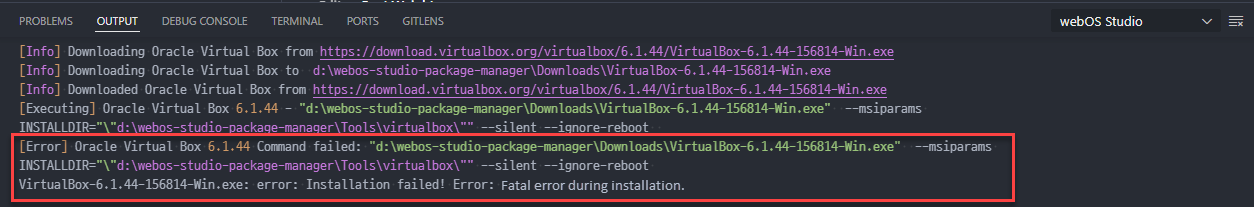
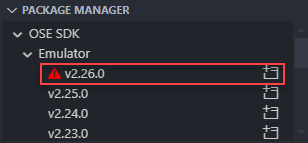
If you got a below error, you have to manually install VirtualBox 6.1.x and then try to install again.
You can manage webOS emulator (VirtualBox) images in VS Code. By default, any webOS emulator images installed in VirtualBox are listed in the EMULATOR MANAGER view.
| Item | Description |
|---|---|
| Python | 3.0 or higher |
| Emulator | VirtualBox must be installed on your computer. (Required version: 6.1.x) |
| Emulator Image | An emulator image for webOS OSE (.vmdk) is required. You can download it from our GitHub or build it your own. |
| Emulator Launcher | Emulator Launcher is also required. (v0.9.4 or higher) Execute webOS: Install Emulator Launcher in the Command Palette (Ctrl + Shift + P). |
Click the + button in the EMULATOR MANAGER view.

Fill in the input form. For the other system requirements, refer to Emulator User Guide.
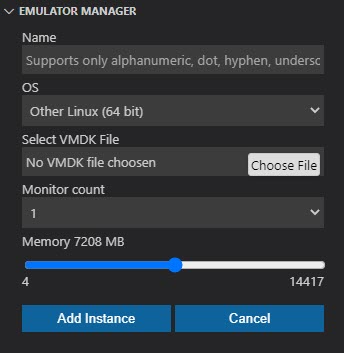
Click Add Instance and the created instance is listed in the EMULATOR MANAGER view.
Click the Run App button (triangle) to run the emulator. This action will launch a new VirtualBox window.
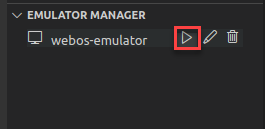
To stop or close an emulator instance, close the running VirtualBox window.
You can analyze the file size of the app or services in the IPK file.
Open the Command Palette (Ctrl + Shift + P) and type webOS: IPK Analyzer.
Click Import IPK.
Choose the IPK file to analyze. After the file is loaded, you can see the following screen:
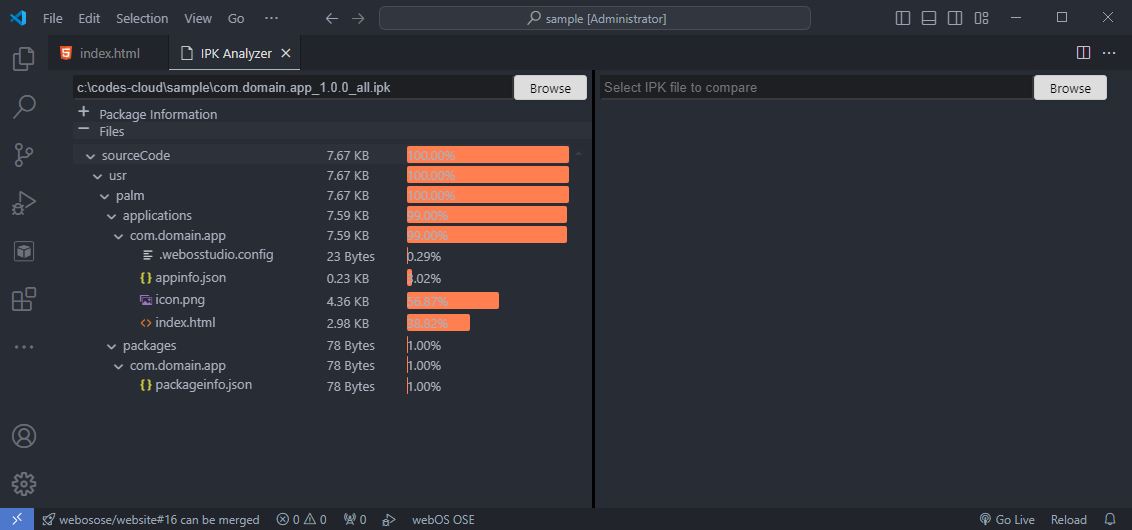
Click the Compare IPK button to load another IPK. (For example, the older version of the original file)
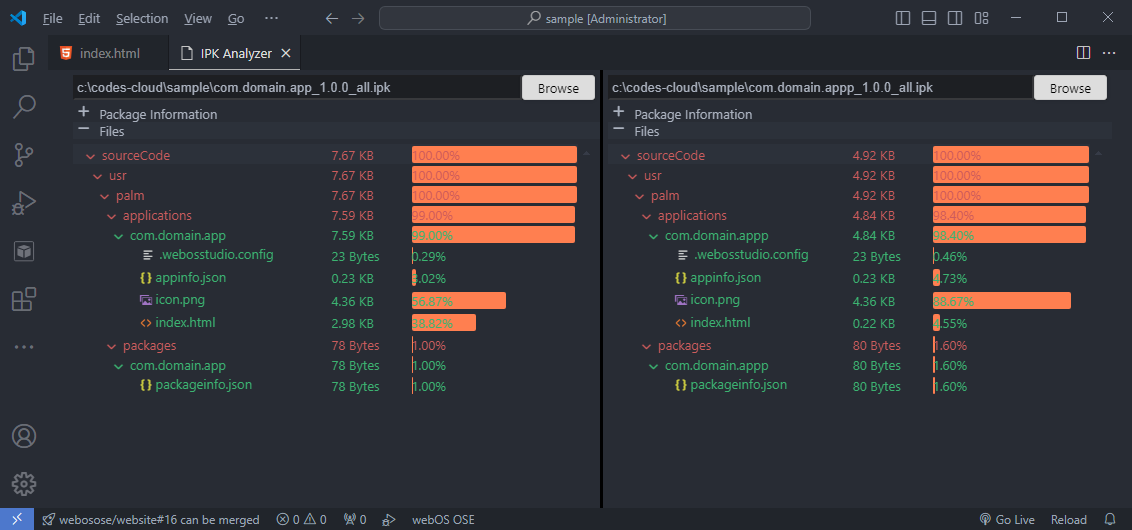
Each color means the following:
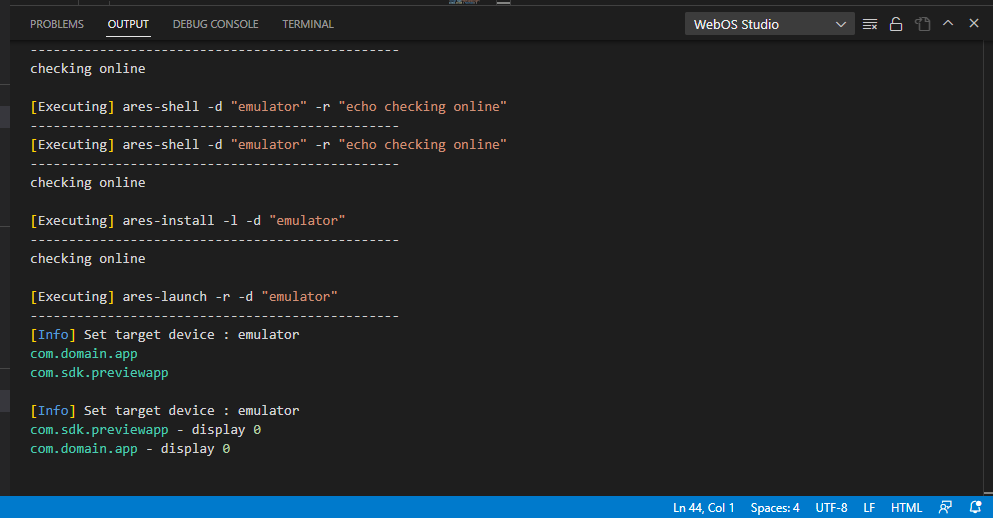
webOS Studio has many internal utility commands including ares-cli, enact-cli, and VirtualBox utility. In the OUTPUT panel, you can check the output logs of these commands. Developers might find out helpful information to debug their apps or services.
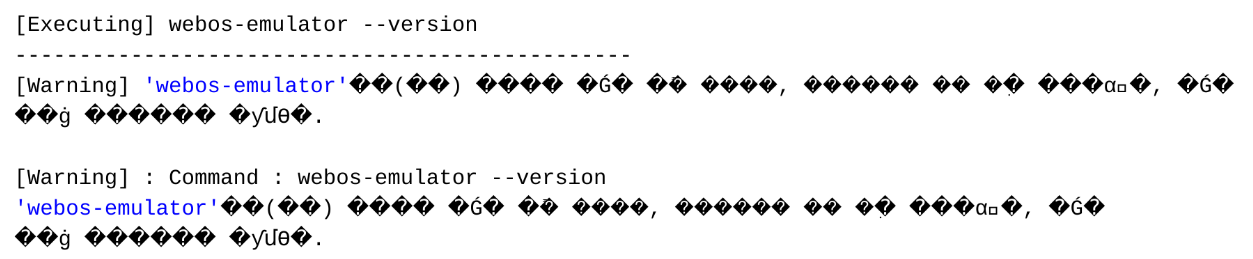
If you get broken log messages (see the below screenshot), use Unicode UTF-8 on your computer.
The Log Viewer displays log messages of the webOS device.
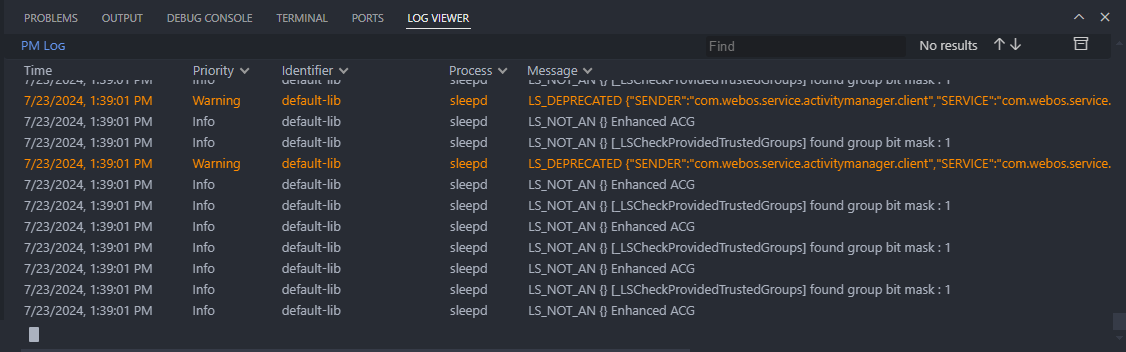
Key features are as follows:
To start the real-time logs, execute webOS: Start Log Viewer in the Command Palette (Ctrl + Shift + P).
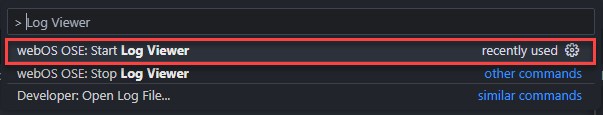
Then the LOG VIEWER panel will be displayed on the bottom.
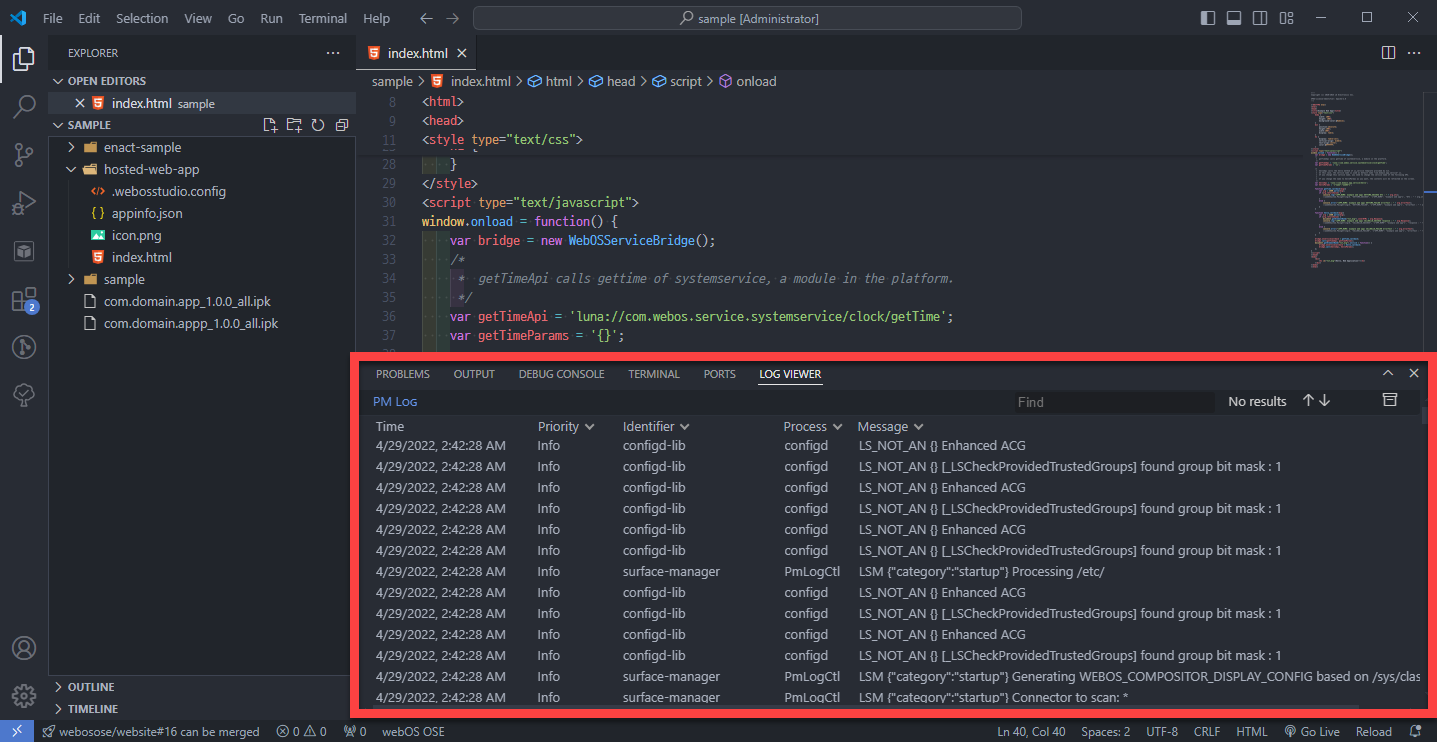
To visualize the priority of the log messages, the Log Viewer displays log messages in three colors: white, orange, and red.
White (default): Normal log messages

Orange: Warning messages

Red: Emergency, alert, critical, and error log messages

If you want to switch the log format from PM log to Journal log, click the Switch to Journal log button as follows (vice versa):
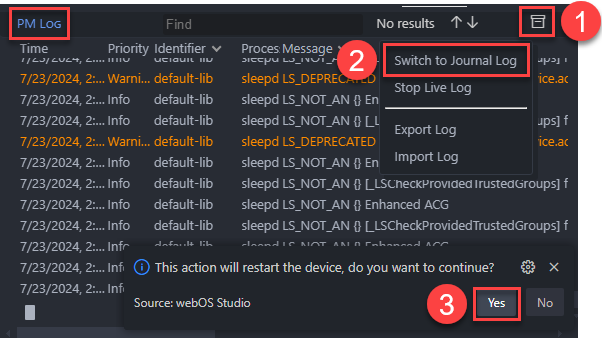
This job will reboot the webOS device and take a few minutes.
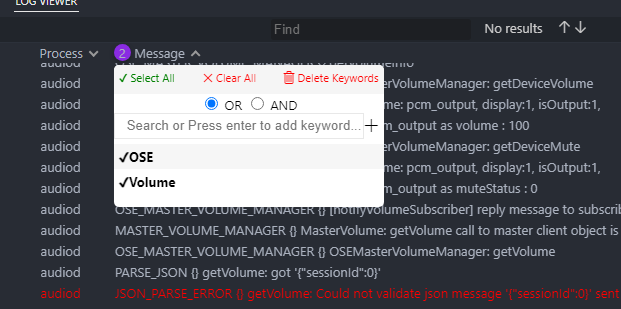
Each column provides the filter option. You can filter out log messages you don’t want to.
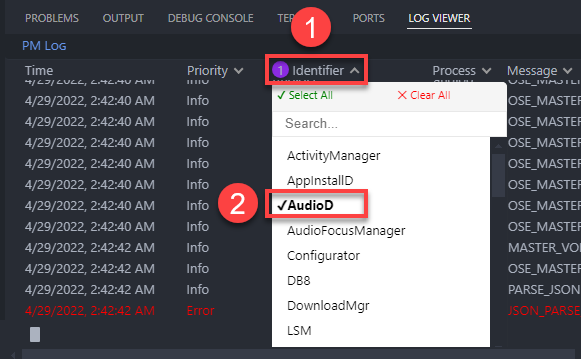
Especially on the Message column, you can combine keywords using OR and AND options. These options filter out log messages which don’t contain the keywords you entered.
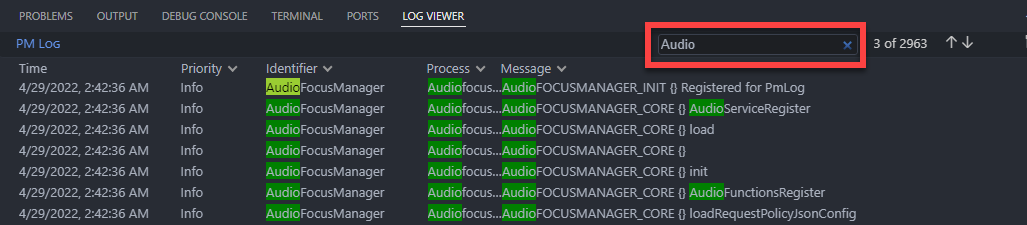
To search log messages, enter a keyword to the search box.
You can import or export logs as follows:
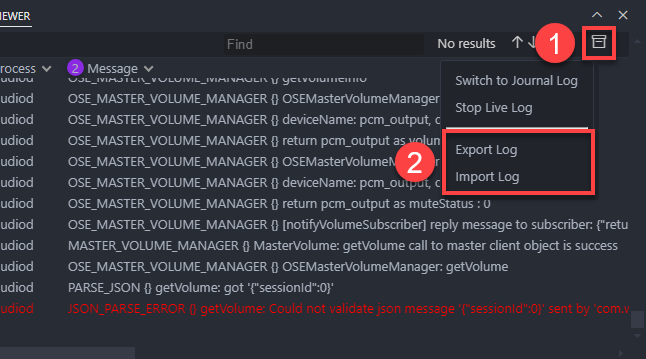
| Action | Description |
|---|---|
| Import Log | Import webOS log file (.zip). |
| Export Log | Export log messages in the current Log Viewer panel. Output files will be generated with .zip and .weboslog extensions. |
The Resource Monitor tracks and visualizes system and memory usage, CPU consumption, and so on. This enables developers to test their apps or services and identify resource consumption trends and patterns.
Developers can set the default dashboad for the Resource Monitor, which is called Provisioned Dashboard.
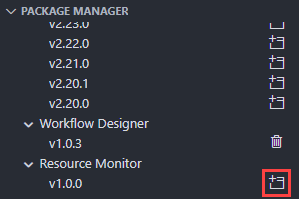
In the PACKAGE MANAGER view, click the icon to install the resource monitor.
To launch the Resource Monitor, do the one of the followings:
webOS OSE: Launch Resource Monitoring in the Command Palette.Then the resource monitor tab will be launched.
Go to your webOS device, stop the Resource Monitor running (if you’ve run it before.)
luna-send -f -n 1 luna://com.webos.service.sdkagent/collector/stop '{}'
Connect the Resource Monitor using the following command. Replace <HOST_IP> into your computer’s IP address.
luna-send -f -n 1 luna://com.webos.service.sdkagent/collector/setConfig '{"agent":{"flush_interval":"5s","interval":"5s"},"outputs.influxdb":{"urls": ["http://<HOST_IP>:8086"]}}'
Set up the dashboard.
luna-send -f -n 1 luna://com.webos.service.sdkagent/collector/setConfig '{"webOS.webProcessSize":{"enabled":true}}'

luna-send -f -n 1 luna://com.webos.service.sdkagent/collector/setConfig '{"webOS.processMonitoring":{"enabled":true,"process_name":["com.webos.app.home","com.webos.app.notification","com.webos.app.volume","com.webos.service.sdkagent"]}}'
Start the monitoring.
luna-send -f -n 1 luna://com.webos.service.sdkagent/collector/restart '{}'
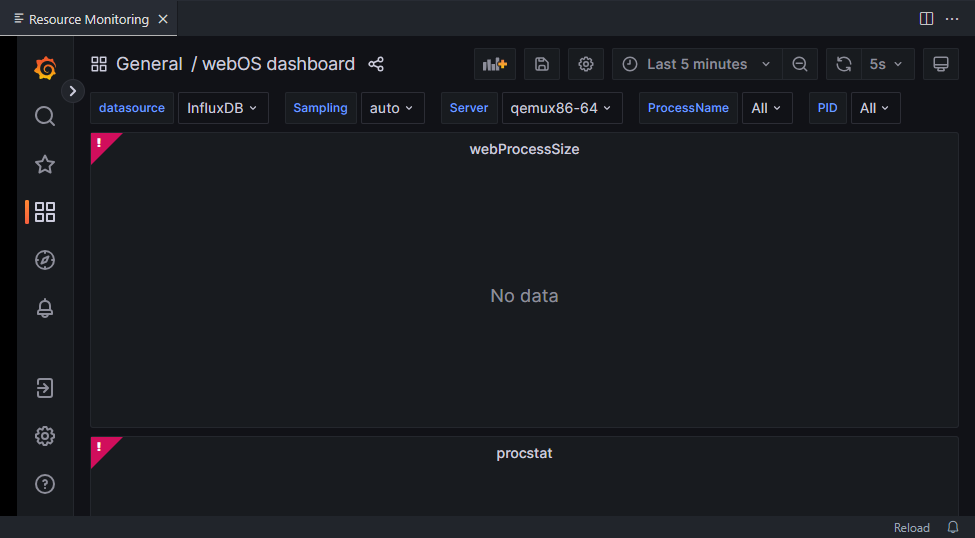
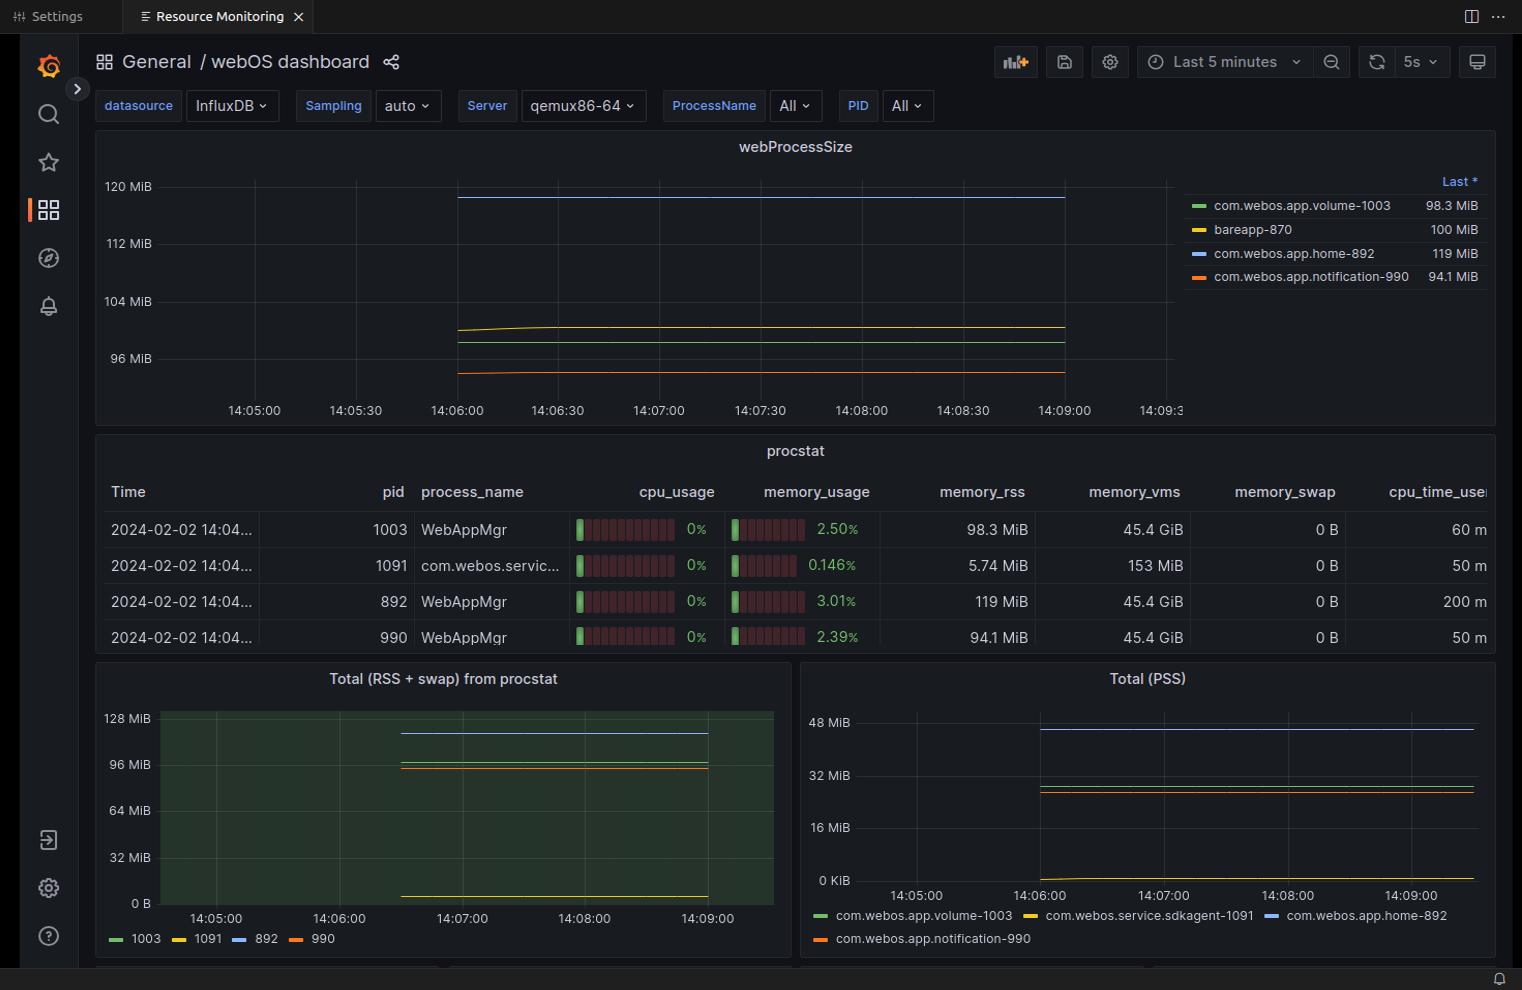
Then the Resource Monitor shows the default dashboard as follows:
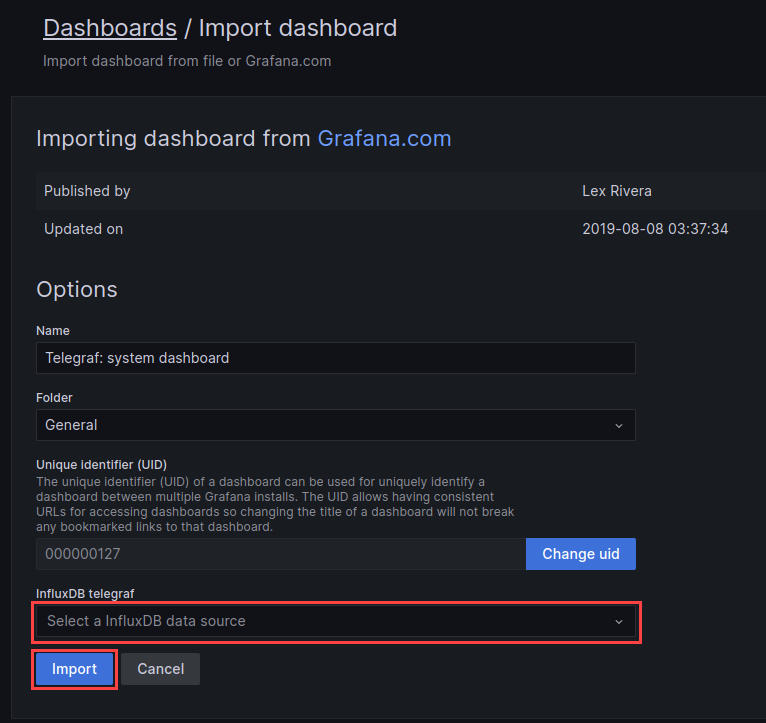
Grafana provides many user-made dashboards. These dashboards can be searched and imported using the Grafana UI.
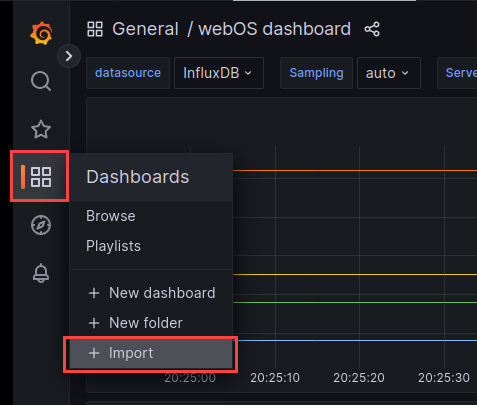
Hover on the Dashboards menu and click Import.
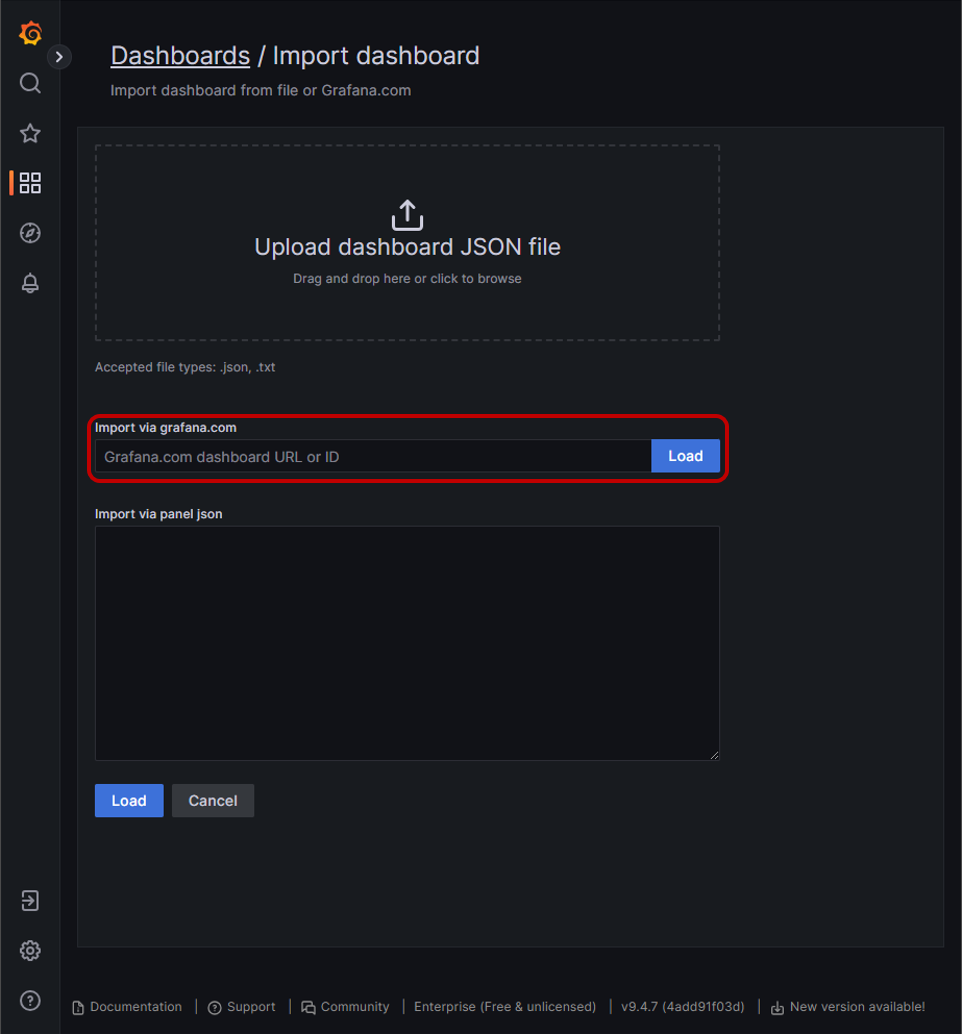
Enter the ID of dashboards and click the Load button.
Recommended IDs are 928, 5955, 2381.
Select the data source and click the Import button.
Go to the Settings, check the webosose > Resource Monitoring: Provisioned Dashboard setting is on.
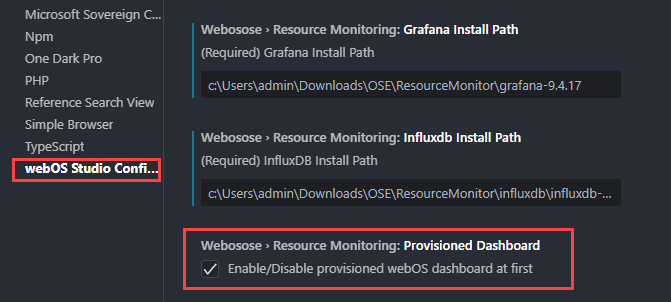
Restart the webOS device and follow the above steps again.
A. Supported types are as follows:
Type | Description |
|---|---|
Basic Web App | Creates a sample HTML "hello world" app that has a standard webOS OSE file system. |
Hosted Web App | Creates a sample HTML app with an example to show some external page in-app with standard webOS OSE file system. |
Web App Info | A dummy web app, which contains only appinfo file to use with any already developed HTML app. |
Basic Enact App | Creates an enact Sample app as per selected template. |
JS Service | A simple JS service with a service file. |
JS Service Info | A dummy service info directory, which is used for reference of standard service information. |
A.This feature adds webos-service library to your project. The webos-service library is to call LS2 APIs in the app/service. But we strongly recommend using WebOSServiceBridge API instead of webos-service library.
A. By default, emulator is added in the KNOWN DEVICE view. This emulator is running on the local system. If you an emulator instance is not already set up, go to the EMULATOR MANAGER view and add the emulator instance.
A. Workspace path and name should not contain any escape or special characters, it can trigger errors on add, package, install operations.
A. A list of the errors:
Error | Description |
|---|---|
ERROR! Failed to get the device list. | Some dependent packages are not available on the local system. To resolve this issue, install the packages either manually or by clicking Yes when prompted (if you previously closed the prompt without installing, click the refresh button in the KNOWN DEVICE view to get prompted again). |
ERROR! Failed to list the applications installed on <device> | The device is not running. |
ERROR! Failed to list the applications running on <device> | The device is not running. |
ERROR! Please check IP address or port of <device> | The device is not reachable. |
ERROR! Unable to find the Virtual Box | Update the environment path variable to point to the VirtualBox installation directory. |
ERROR! Packaging App Failed. Details As follows: <errMsg> | Failed to package the app due to one of the following:
|
Contents